

24 Mar Create a Map to Explore Application Performance
Introduction
There is nothing like trying to explore an unknown city without a map. In every city we know we’ll find buildings, roads, bridges, and on and on. In the same way, when it comes to performance testing, we know the main features of the application landscape. Join me as we touch on just a few of the excellent insights that Mark Tomlinson shared in his PerfGuild 2017 “Advanced Performance Exploration” in learning how to create useful maps to explore the applications we test.
Bottlenecks Are There
Before we get into the basics of creating a map for our performance exploration, we need to start with the reality and certainty that in every computer-based application, there are bottlenecks. Infinite resources do not exist. We don’t have infinite money, infinite CPU, infinite bandwidth, so there are bottlenecks that matter somewhere. The business will inform us what is important, but make no mistake there are bottlenecks! And we can find them with the help of our map!
Everything Is A Computer
As we explore an unfamiliar city, we know the kinds of features we’ll come across. In the same way, in applications, there are features that are always there. First of all, in every part of every application is a computer. And every computer has the following four components:
- CPU
- Memory
- Disk
- Network
Every kind of computer has all these four physical resources, including your phone, laptop, network routers, switches, cell towers, and every server on the planet.
Logical and Abstract Resources
And running on every computer, there are logical resources which depend on the physical. Specifically:
| Logical Component | Examples |
| Operating System
|
Linux, Windows, MacOS, iOS, Android |
| Platform / Framework Software | Java, .Net, SQL Server, Oracle, Ruby on Rails, Angular JS |
| Application Specific Software
|
Salesforce, Slack, Dropbox |
And there are abstract resources which include:
- Time (it’s limited, we can’t just go out and buy more)
- Number of Users
- Activity of the Users
A General “Exploration Map”
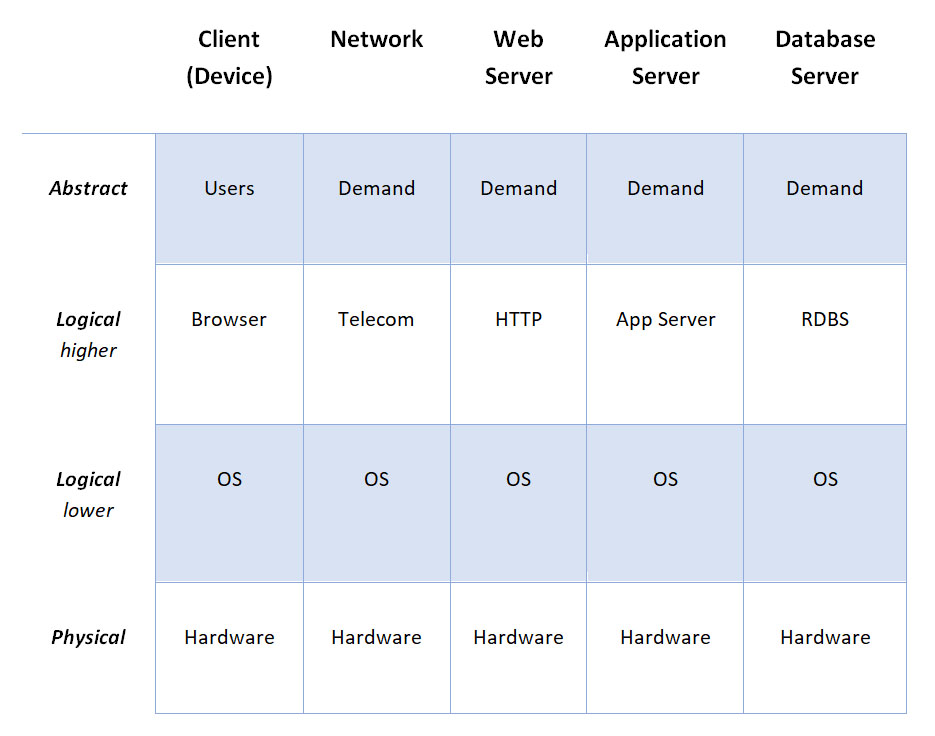
Knowing all of this we can now create a general map which we can intentionally explore as we test our application. It would be a mistake to labor to get every detail of every tier in our application at the outset. Instead, start with the general, and fill in the details as needed.
The following is a general map for a classic web application. (I know it looks like a table, but if you use your imagination, it can be a map).
Let’s Go Exploring
Now with our general map in hand, let’s explore. We can run a variety of performance tests to look for, find, and fix bottlenecks. Here are just three ways to leverage your map:
- Methodical Exploration ~ Work methodically from left to right, and go up and down the map
- Interrogation ~ Overload a specific component
- Loose Thread ~ Find a vulnerability and exploit it
Now go for it! Run some tests, gain some certainty and knowledge, find those bottlenecks, and improve your application’s performance.
Blog Tom Horsfield, March 2020