
24 Sep Test the “Risky” First and Improve the Quality of Your Software
The following is a blog based upon the Quality in a Quick video episode “Risk Analysis and Risk Scoring” which aired on YouTube on 1/22/18.
One of the most common questions I’m asked by organization’s leadership is “what change, what process should we implement to quickly improve quality in our organization?” There are two things I consistently specify. Peer reviews (which I’ll be presenting that in a future blog) and a topic I absolutely love…risk analysis as it applies to quality assurance and software testing.
If you think about it, a primary goal of a software tester is to reduce the risk associated with the deployment of software into production. It really does make sense, doesn’t it? The very process of test planning should be based upon an understanding of the types and magnitudes of risk throughout the entire software application lifecycle. In that sense, I’m going to present risk analysis in the context of software testing.
What is the risk equation? The risk equation, plain and simple, is: RISK = LIKELIHOOD X IMPACT. Likelihood is also known as probability. Impact is also known as criticality. The software tester must understand what loss can happen and the likelihood it will (or will not) happen.
With risk analysis, you must ask…how risky is it? How likely is it to happen in production? What will happen if the functionality our test is validating fails in production? That could be a disaster. Therefore, it’s beneficial to calculate a risk score, whether it’s for your requirements, test cases, and/or defects.
The value of calculating a risk score is incredible! Generating a risk score can help identify high-risk applications or functionality and resources can be allocated appropriately. Testing can be focused on critical components, and/or quality dimensions, most important in an application system. And it allows you, it enables you, to find the scariest defects early, giving more time for the developers to resolve the defect. And I absolutely guarantee, they will love you, the tester, for that.
When you’re looking at the risk levels involved in the risk equation, we’re going to talk about two different levels for risk scoring. The first one we’re going to address is impact. As I mentioned before also known as “criticality. Impact is the consequences of failure to your organization, or the potential loss to your organization, if that risk should occur.
Likelihood, also known as probability, has numerous factors involved. You must consider: the application or module size, the system environment, reliability, the technology integration, and several other factors when you’re looking at the likelihood.
With component scoring, you’re going to start by assessing the impact. The impact can be as simple or as complicated as you want (perhaps you identify eleven different ratings of 0 – 10. With the impact, you may determine the failure of certain functionality in PROD to have an impact rating of 0 (zero), which means “no impact at all, you’re good”. Or it might be an impact of 10, considered a major impact…a major loss to your organization such as potential loss of life, perhaps.
You can go less granular with your impact ratings, and perhaps just come up with five different ratings
for the impact.
The next thing that you’re going consider is some of the different risk dimensions because these risk dimensions come into play when calculating the likelihood. Because when you think about it, for example, if you’re implementing brand new technology, the likelihood of failure is higher.
Some different parameters you assess are: criticality or mission impact; the system-side scale and complexity; the system environment and stability; reliability and integrity; and as I mentioned, technology integration. All play a role in the likelihood as to whether certain functionality might fail once it’s in production. You can absolutely come up with other parameters if you choose.
With the component scoring procedure, the process you’re going to follow with risk analysis involves the comparison of other components in the same application. And there are three steps to scoring an application.
- Determine the impact of failure
- Calculate the probability score.
- Plot those scores on a risk analysis scoring chart.
Review Figure 1 and allow me to present the quadrants in reverse order.
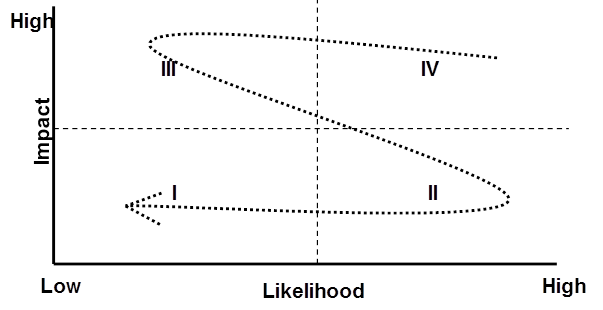
Figure 1: Risk Analysis Scoring Chart
- Quadrant IV is high impact (aka criticality), high likelihood (aka probability)
- Quadrant III is high impact, low likelihood
- Quadrant II is low impact, high likelihood
- Quadrant I is low impact, low likelihood
You’re going to use the results to focus your testing efforts. Focus…what an interesting concept! You’re first going to focus on the components in quadrant four. Test those first. Next, you focus on quadrant three, and so on. Two, and then last, one.
You’ll find if you are not able to test everything, your leadership will be impressed (I would hope) if you’re at least able to say “hey, I’ve tested at least all of the high impact, high probability; high impact, low probability; and so on, first.”
I hope you found this beneficial. It is, without a doubt, an excellent strategy to improve your testing processes and increase the quality of your applications!
If you have any feedback, any questions, or any topics you’d like address in future blogs or “Quality in a Quick” videos, please email me at bcrews@checkpointech.com. I’m Bob Crews, President and Co-Founder of Checkpoint Technologies.
Thank you so much. Make it a great day!
Bob Crews
Email: bcrews@checkpointech.com
LinkedIn: www.linkedin.com/in/bob-crews-checkpointech